
Lead-source value
Compare the volume, conversion and value associated with different routes into the business.
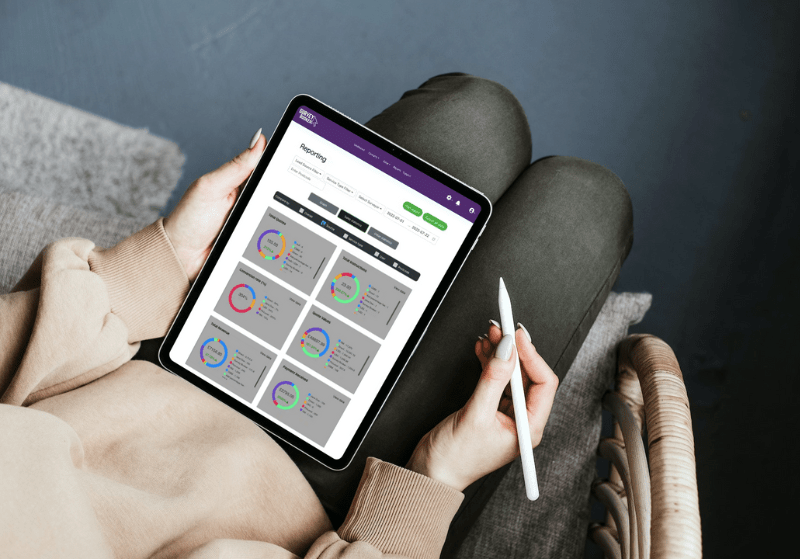
Bring sales, customer journey and operational reporting together to understand how your surveying practice is performing.
Use clear dashboards, flexible filters and accessible reporting to identify what is working, where opportunities slow down and where informed action can make a difference.
Survey Booker turns the activity already taking place across enquiries, quotations, instructions and completed jobs into practical reporting. Compare the areas that matter, investigate change and give decision-makers a clearer operational picture.
Explore the results behind your sales activity, from the sources generating enquiries to the services, locations and team members converting them into valuable work.
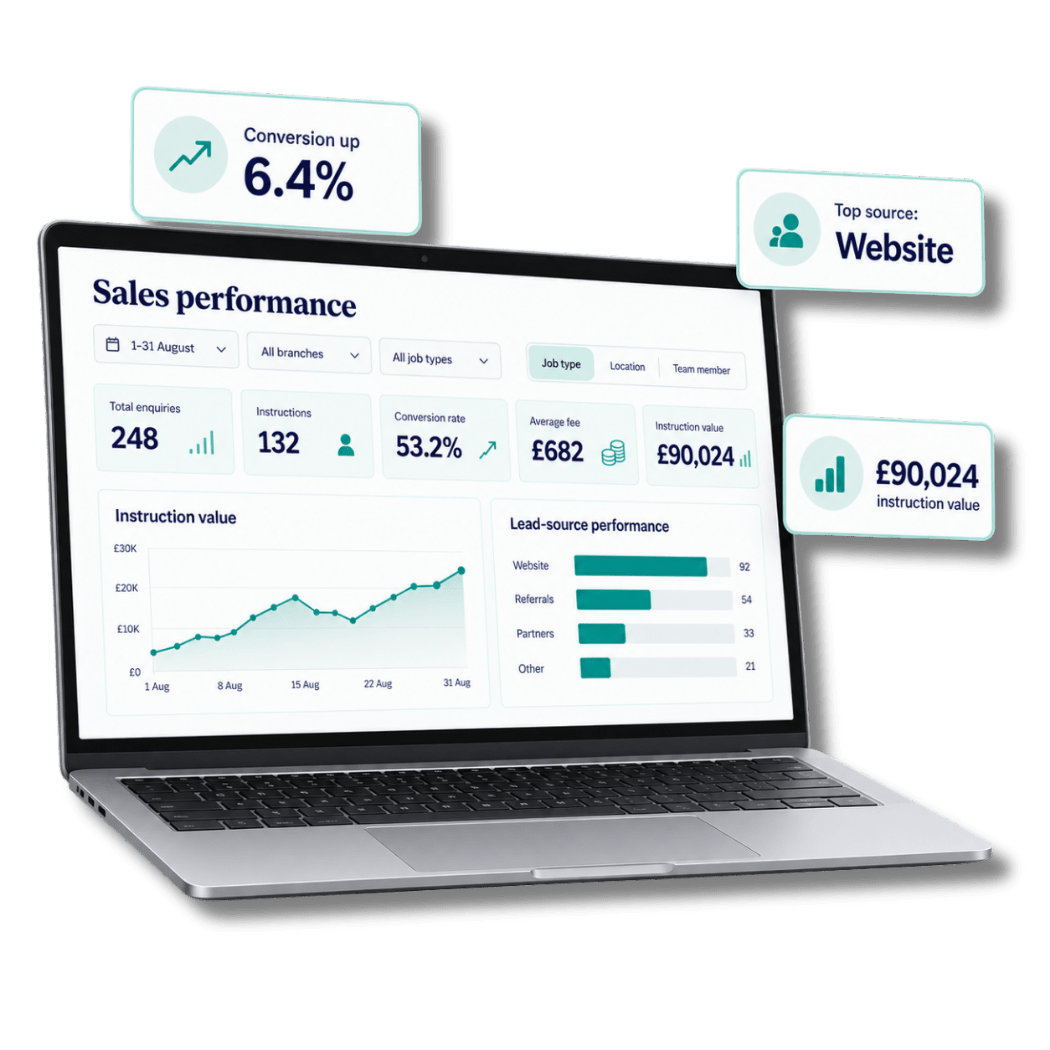
Compare lead sources, job types, locations, fees and individual or team performance using the filters relevant to your reporting question. The aim is not simply to display more numbers, but to make patterns easier to recognise.
Compare the volume, conversion and value associated with different routes into the business.
Follow how enquiries and quotations become instructions across periods and service types.
Understand average fees and instruction value by job type, location or another useful segment.
Identify strong results, changing workloads and areas where additional support may be useful.
Measure more than the final outcome. Explore how long different stages take, how conversion varies and why potential customers decide not to proceed.
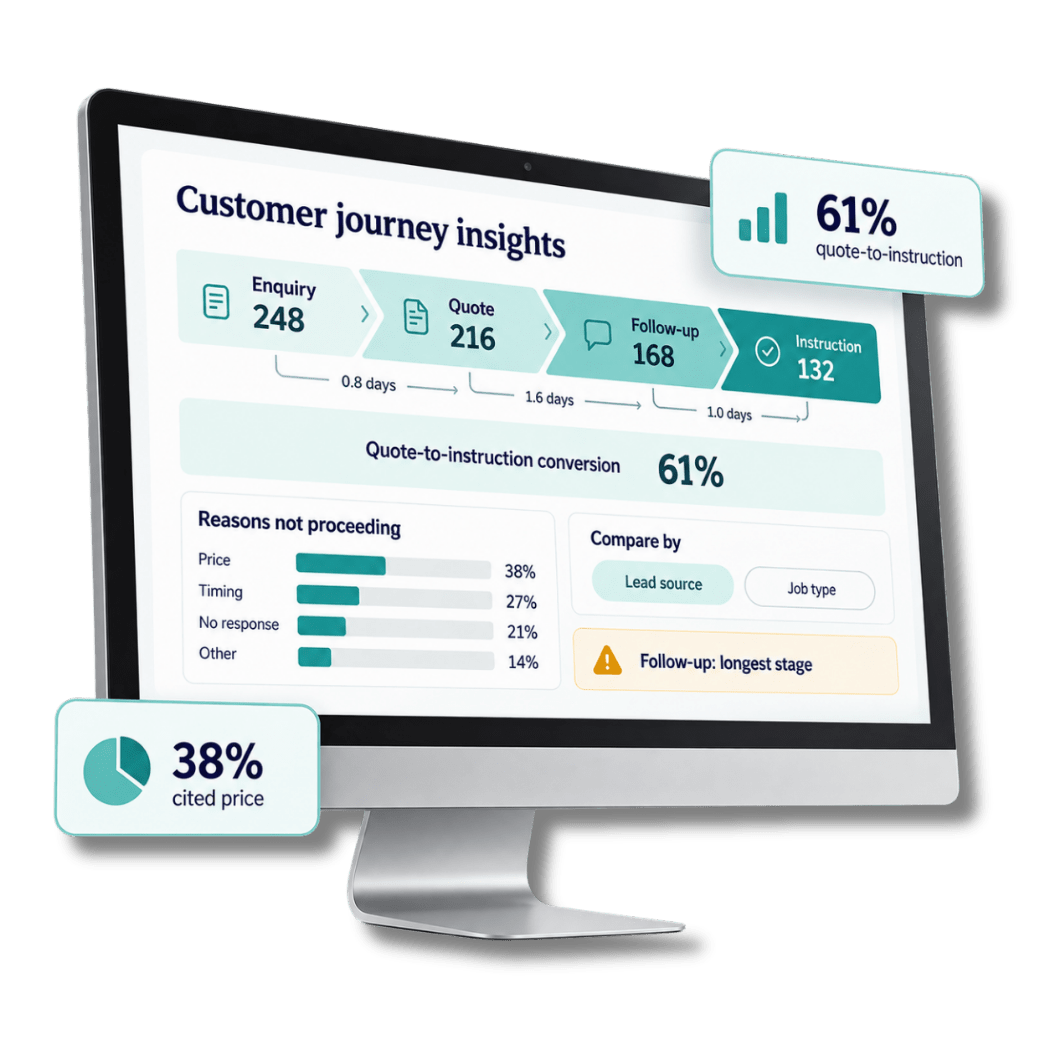
Review the time from enquiry to quotation, follow-up and instruction, then compare the journey by job type, lead source, branch or reporting period. Reasons for lost opportunities add useful context to the conversion figure.
Use multiple filters to narrow the view and investigate the part of the journey that matters.
Spot stages that consistently take longer or produce a disproportionate number of lost opportunities.
Give teams clearer evidence when refining follow-up, allocation or customer communication.
Access reporting based on the job information already held in Survey Booker, then filter and extract the data needed to support your professional indemnity insurance renewal process.
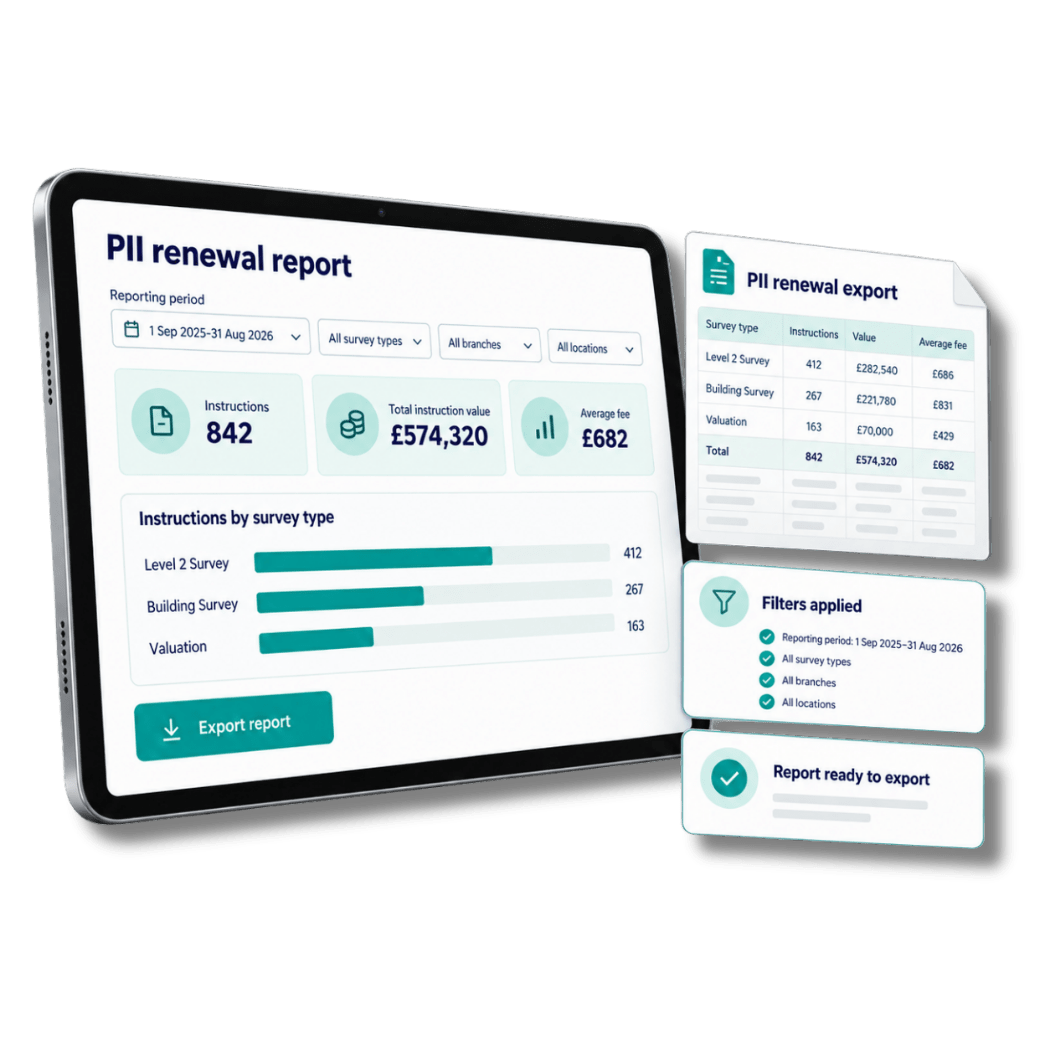
Survey Booker’s reporting does not have to end inside the platform. Export available information or use API connections to support tailored dashboards and wider business intelligence.
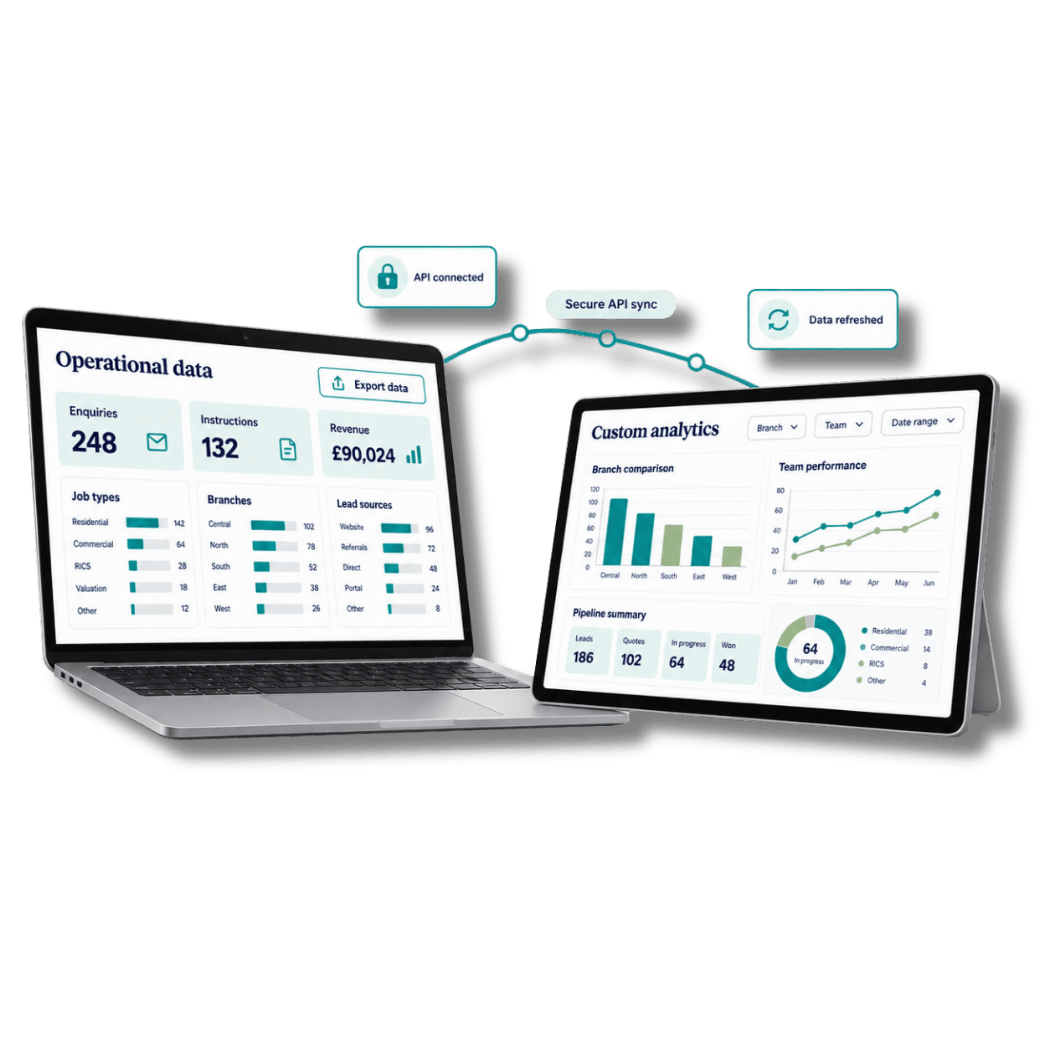
Bring relevant Survey Booker information into external reporting systems such as Microsoft Power BI, helping larger businesses combine surveying workflow data with the other measures used across their organisation.
Present the measures, comparisons and structures relevant to your own reporting requirements.
Use compatible tools to bring Survey Booker information alongside other business data.
Give analysts and decision-makers appropriate access to shape more specialised reporting.
Good reporting does more than confirm what has happened. It helps a practice understand what to do next.
Performance insight with purpose
Explore the specialist tools that create the activity behind your reporting and help modern surveying practices work with greater clarity.
See how Survey Booker supports both survey and valuation practices and project-led businesses through connected operational workflows.
Book a tailored demonstration to explore the dashboards, filters and reporting options relevant to your team and business structure.